I recently figured out how to map a game chart into a game button. How do you create tabs so that you can put several game charts in a game button, that players can then select from?
When you go to your chart in the editor, you’ll notice you have a parent element called a “Chart Window Menu” (or something like that), and then you’ll have your chart itself as a child element. Right click on your parent element and you can add a “Tabbed Panel” to it. You can then drag your chart to be a child of the Tabbed Panel. Then add the rest of your charts (either create them from scratch if you haven’t yet, or drag them in from wherever they are). Should work how you want after that!
Brian
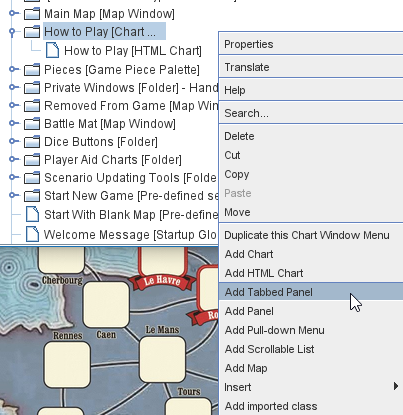
Here’s one where I just have one HTML Chart in the window, and I’m about to add a new Tabbed Panel
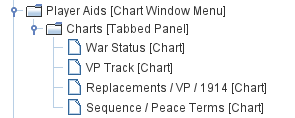
Here’s one where I already have several Charts organized into a Tabbed Panel.

In Brian’s image, he’s right-clicking on a Chart Window Menu node in the Editor. In your image, you’re right-clicking a Board inside the Map Boards node of a Map node. These are completely different things. I don’t know what AxisOC is meant to represent, but if that’s where you mean to put charts and reference material, you probably want to delete that node and recreate it as a Chart Window Menu instead.
I didn’t create the game module. I’m simply asked to insert my game charts in it. The process should have been a self help no brainer, but as you can see I got all tripped up. The module designer suggested I make a separate button in the game for each chart, but I was thinking it would simply be easier to have one button and tab the game charts. I digress… 
You will need to add a “Chart Window Menu” to your module (you can right-click on root item at the very top to add it, or you can insert it lower). Then add the Tabbed Pane to that. Then add some kind of chart to that. If you need to add a “Map” to make it like what it was before then you can do that and then configure it to be like the existing map that you have.
Worked like a charm, thank you. Unfortunately the edit option grayed out after I saved my first tabbed chart so I can’t proceed with adding more.
The option to edit the module at all? Usually that greys out when you already have the module open in VASSAL (e.g. you’re already playing the module or whatever). So check and make sure you don’t have it open in another VASSAL window. If that doesn’t work, close VASSAL all the way down (close every VASSAL window you have open) and start from there – should clear any greying-out.
You’re spot on, as usual. Trouble now is only the last chart & Tab entered shows in the game. Oh and how do I save the game so I can share it?
All the actual charts should be children of (organized “below and within”) a single Tabbed Panel. In other words you have ONE [Chart Window Menu], ONE [Tabbed Panel], and then as many charts inside it as you need.
By save the game I imagine you mean save the module so that others can use it once your charts are in it? If so you do that from the File menu of the Editor Window. It will save it as a .VMOD file and you can give that to whoever asked you for the charts – or you could upload it to the module library as a new version of the module if you’re comfortable with wiki stuff.