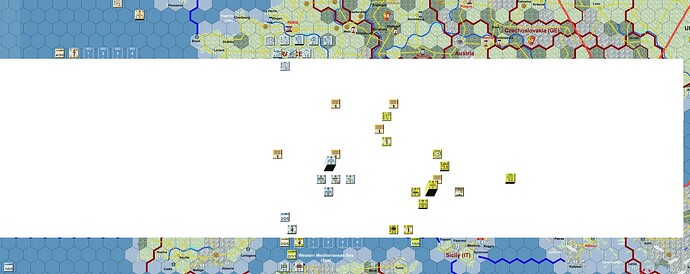
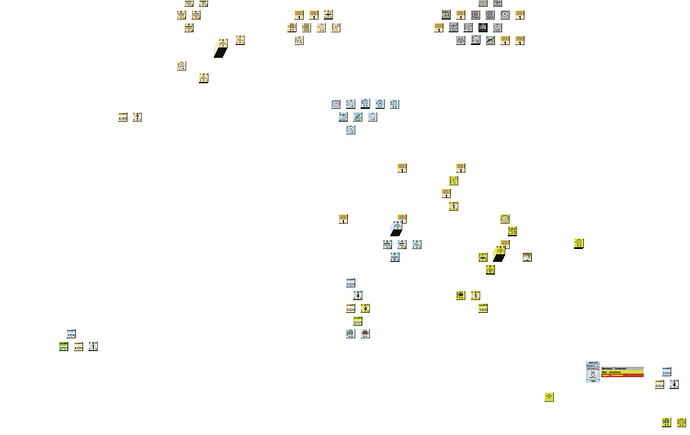
The map display just keeps cycling through white patches and the map display. Sure taking a lot of CPU time (80+%) and RAM (6400MB). Quite disconcerting. I upped the JVM max heap size to 7000MB (from 6000MB) and it seems to behaving better now. CPU nominal (0% to something way less than 80%+, but RAM usage now showing as circa 7300MB). Did not have this issue with 3.6.19. Perhaps I should also check out Beta5, just for a comparison). I’ll get back on that point later. Participating in an online game ATM.
Please show us an errorLog from a run where the problem occurs.
I just fired up the 8,542 version and started the large 4 map scenario and it took 2.7Gb on my system.
I’d be interested to see your save game, I can load it and profile it and find out where the memory is going.
Sorry, error log last entry was as per my other post - that is the last refresh counters.
I’m not looking for the last entry. I’d like to see the entire errorLog.
8.542 version? That is non current and not even developed by me. This module of world in flames uses the NASA blue marble maps to create a single scale world (SSW) for world in flames players. The maps, even at 256 colours take a LOT of memory.
I’m uploading the current file now to google drive. Link to follow
The color depth is irrelevant for the amount of memory used. Images are stored in memory at 4 bytes per pixel regardless of the color depth on disk.
Probably gone now. Closed 3.7 launcher and launched 3.6.49–19 for tonights game.
Just checked, yep error log zero’ed
Also, could you please explain why looking at the entire error log, which was quite long, would actually be of benefit when there were, in fact, no actual errors reported? Remember, the error log contains everything vassal records, not just errors but all the successes as well. We have had this ‘debate’ before now.
I was talking about the file size. Like a 960MB file versus a 300MB file. That is what the difference in colour depth meant.
I am not looking for an error. What I want to see specifically is with what arguments the Player was launched—but the errorLog in its entirety frequently reveals other problems that I wouldn’t specifically know to ask about.
Maybe you could recreate the problem and post a new errorLog.
Tomorrow. I’ll need to reset the JVM to 6000MB as well.
Reset the JVM to 6000MB and loaded the same game. No issues arose. So now we have a potential intermittent issue, or maybe just my system being weird. If it does crop again, I will ensure that I get a copy of the error log.
I’m having the same problem with the ‘A Most Fearful Sacrifice’ module, for what it’s worth.
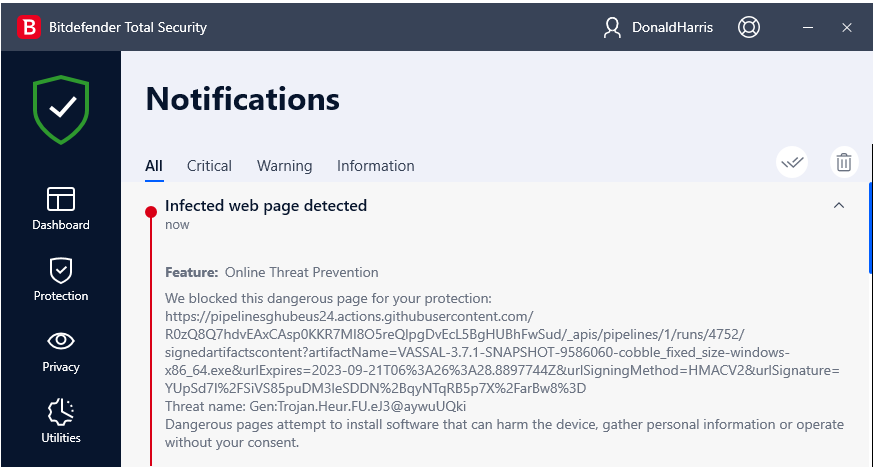
Please try the VASSAL-3.7.1-SNAPSHOT-9586060-cobble_fixed_size build from our builds archive and let me know whether this fixes the problems you’re seeing.
Thanks Joel, will give that a try. The issue popped up again Tuesday night (late) and I forgot to copy the error log. But, I was using 3.7 to open a 3.6.19 module. So still a sort of intermittent malfunction. Those can be very difficult to track down.
My oldest son was recently experiencing a memory usage issue with the website he’s responsible for. He eventually found the problem, one line of code. Needle and haystacks comes to mind.
Seems Vassal development has progressed since your post though, with some ‘masters’ there since the cobble_fixed_size build. Should I only use that build or will the later versions, in particular the latest master build?
Forget previous. 3.7.1 has been released and I note that * 12727: Ensure that tiles are cobbled for fixed-size board scaling is included, thus obviating the interim build.
You’re getting a false positive from Bitdefender. You should report it.
That’s basically the only route we have to stopping false positives, and in most cases people who are not having the false positive have no way of doing the reporting.
Will do. Thank you. Added words to reach 20 count required.
