See the below images:
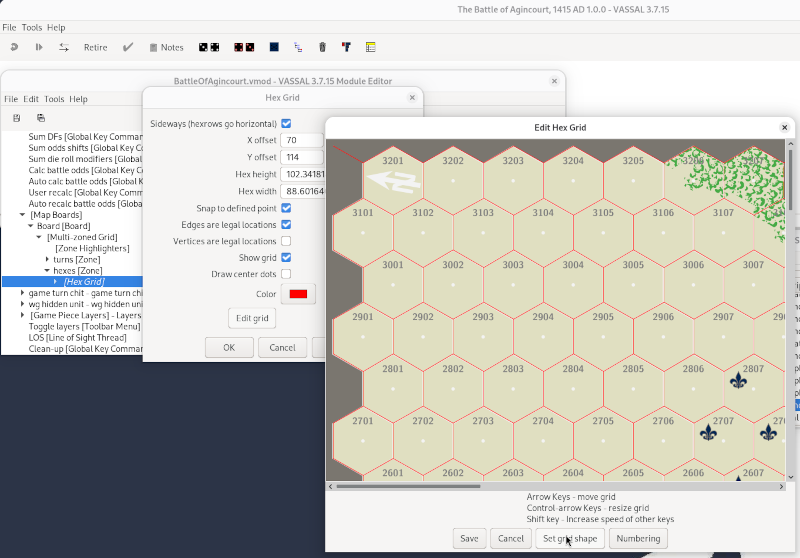
Edit grid editor window
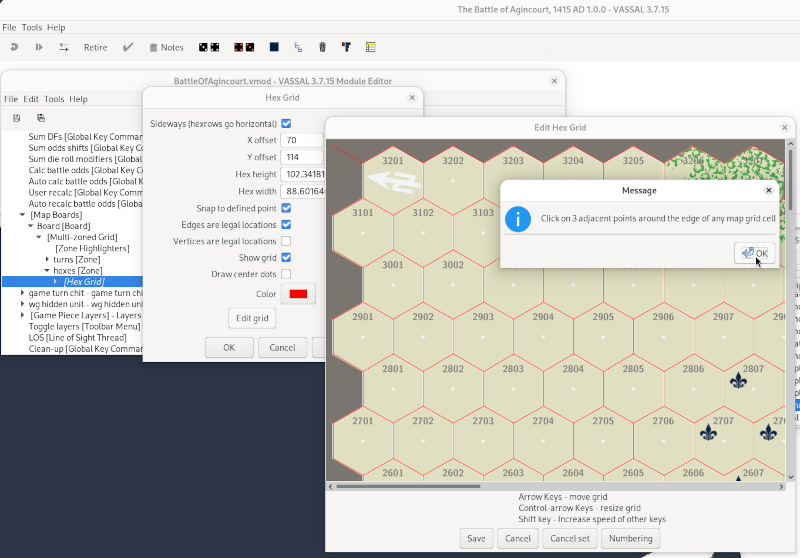
Define grid shape editor window
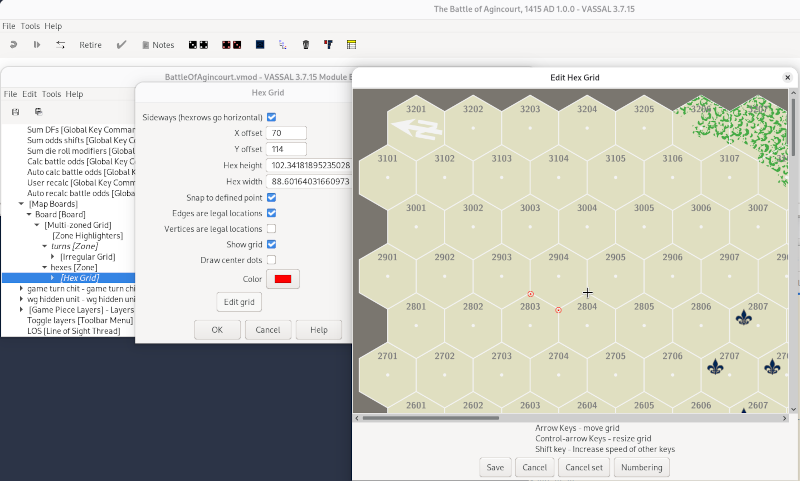
Define grid shape with 3 points
The top image shows the grid editor window. Note that I made the grid (temporarily) visible with a clear colour (red) to make it stand-out. Also note the button Set Grid Shape, which the mouse hovers over. The middle picture shows the dialog that pops up if you press that button.
By clicking 3 adjacent points on the board image, you can define the exact shape of the grid. This is shown in the bottom picture.
Note that the width and height numbers set for the hexes is somewhat oddly calculated. See the picture below.

The dimensions w and h are set the same way whether the hexes are placed edge or vertex up. Note that w is the horizontal offset between hexes in neighboring columns, while h is the horizontal distance within the same column.
Note, for ϑ=60° cosϑ=½ and sinϑ=√3/2≈0.866
When you say “resize the grid using those keys” are you sure you hold down Ctrl while pressing ←, →, ↑, or ↓? Also check that you haven’t mapped your Ctrl (left or right) to some other key-code.
That is correctly remembered - except its really relative to the image - not the window (minor detail, but sometimes important). Also note, that an offset of (0,0) means that the first hex is centred in the top-left corner - i.e., only a quarter of the hex will be visible. To make the hex fully visible you need offset=(2*w/3,h/2) if edge-up and offset=(h/2,2*w/3) if vertex-up.
Zones are always defined as (possibly irregular) polygons. See the image below - specifically the coordinates of the polygon vertices in the bottom-left.
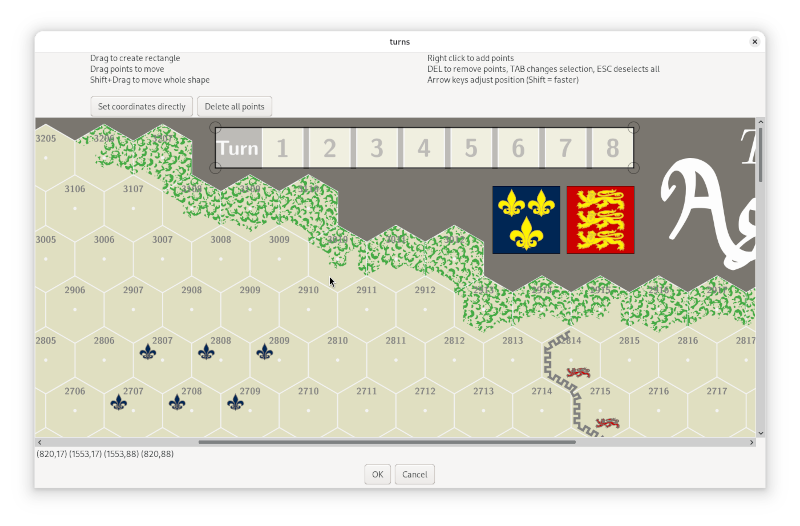
That means, if you want to make a circular zone you need to build it up through small line segments (not too small, as it will then mean an excessive number calculations needs to be done).
If you want a “circular” zone, and know the centre of the zone - say cx,cy, the radius r, and the number of segments you want, you can calculate the vertices with (Python code)
from numpy import pi, cos, sin, linspace
n  = 10
cx = 100
cy = 100
r  = 50
a  = linspace(0,2*pi,n+1,endpoint=True)
ca = r * cos(a)
sa = r * sin(a)
print([' '.join([f'{x+cx},{y+cy}' for x,y in zip(ca,sa)])
You can then copy’n’paste that output into the dialog you get from pressing Set coordinates directly in the zone editor window. If you want a rectangle with rounded corners, centered at cx,cy, of width w, height h, and rounding radius r, and n segments per rounded corner, then
from numpy import pi, cos, sin, linspace
n  = 10
cx = 100
cy = 100
r  = 3
w  = 50
h  = 30
a  = linspace(0,pi/2,n+1,endpoint=True)
ca = r * cos(a)
sa = r * sin(a)
print(' '.join([f'{ x+w/2-r+cx},{ y+h/2-r+cy}' for x,y in zip(ca,sa)]+
               [f'{-y-w/2+r+cx},{ x+h/2-r+cy}' for x,y in zip(ca,sa)]+
               [f'{-x-w/2+r+cx},{-y-h/2+r+cy}' for x,y in zip(ca,sa)]+
               [f'{ y+w/2-r+cx},{-x-h/2+r+cy}' for x,y in zip(ca,sa)]+
               [f'{ca[0]+w/2-r+cx},{sa[0]+h/2-r+cy}']))
Finally, please remember to flag the answer that best helped you (as detailed in How to report problems) and possibly leave a ![]() on those posts that helped you. This will help other users with the same or similar problem more easily identify useful answers. This also goes for Adding Layers Trait in a Prototype then adding selected image to layers for each unit and Absolutely beginner wondering about software options for image editing with iPad
on those posts that helped you. This will help other users with the same or similar problem more easily identify useful answers. This also goes for Adding Layers Trait in a Prototype then adding selected image to layers for each unit and Absolutely beginner wondering about software options for image editing with iPad
Yours,
Christian